Creative Minds 𖹭 Happy Hearts

Reaction Speed of Different Age Groups Lab Sheet
A 30-centimeter ruler and a willing partner are all it takes to turn the reaction speed of different age groups into hard data your student actually collected themselves.
Your homeschooler begins by forming a hypothesis about whether age affects how quickly someone can catch a falling ruler, then works through nine steps with a partner from a different age group. The data table captures four trial distances per participant, an average reaction distance, and a relative reaction speed rating, giving grades 5-8 students a concrete, repeatable dataset to analyze rather than a single lucky catch.
The analysis section pushes thinking further, asking which age group was fastest, which was slowest, what patterns appear in the data, and what might explain the differences. Slotted into a human biology or neuroscience unit study, this reaction speed of different age groups lab demonstrates how to control variables, calculate averages, and draw evidence-based conclusions from self-collected results.
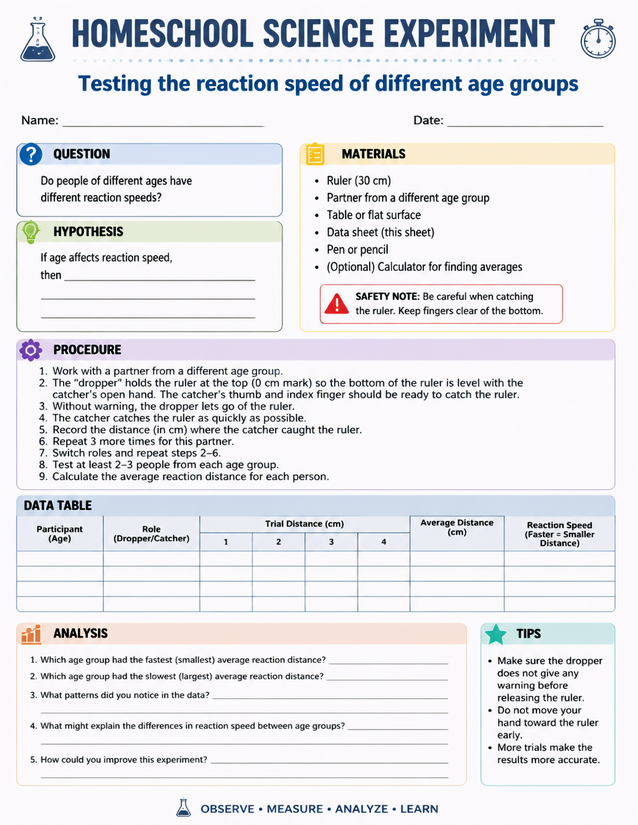
Grab a ruler and a partner: the reaction speed of different age groups experiment suits grades 5-8 homeschoolers perfectly. Instant download.
Investigating Reaction Speed of Different Age Groups with a Ruler Drop

Usage Notes
Everything on the materials list is household-ready: a 30 cm ruler, a flat surface, and a pen or pencil. The optional calculator is the only addition worth flagging. The sheet includes a safety note reminding students to keep fingers clear of the ruler’s bottom edge during catches, which is worth reviewing with your student before the first trial.

Printing Tips
Twenty-four-pound paper is sturdy enough for pencil entries during active testing. Print one sheet per student pair, or slide a completed sheet into a lab notebook after the experiment wraps up for a clean permanent record.